Net Promoter Score is one of the most widely used customer loyalty metrics and one of the most frequently mis-implemented. The premise is simple: ask customers one question on an 11-point scale, segment them into promoters, passives, and detractors, and track the score over time. It works because it is simple. Most implementations make it worse by making it complicated.
The standard failure mode: a team learns about NPS, decides the two-question survey is too short to be useful, and adds eight more questions about product features, support quality, pricing, and onboarding. The survey goes from a ninety-second experience to a seven-minute one. Completion rates fall. The responses that do come in are from either very happy or very unhappy customers, which skews the distribution toward the extremes. The score becomes meaningless as a benchmark because nobody else measures NPS the same way anymore.
This post covers the exact template that works, the one follow-up question that matters, how to segment the scores you receive, and what to do with the data — including the detractor response workflow that most teams never build.
The Two Questions
The NPS template is not two questions plus a comment box. It is two questions precisely because two questions is what produces useful data at scale.
Question 1 — the NPS question:
"On a scale of 0 to 10, how likely are you to recommend [company/product] to a friend or colleague?"
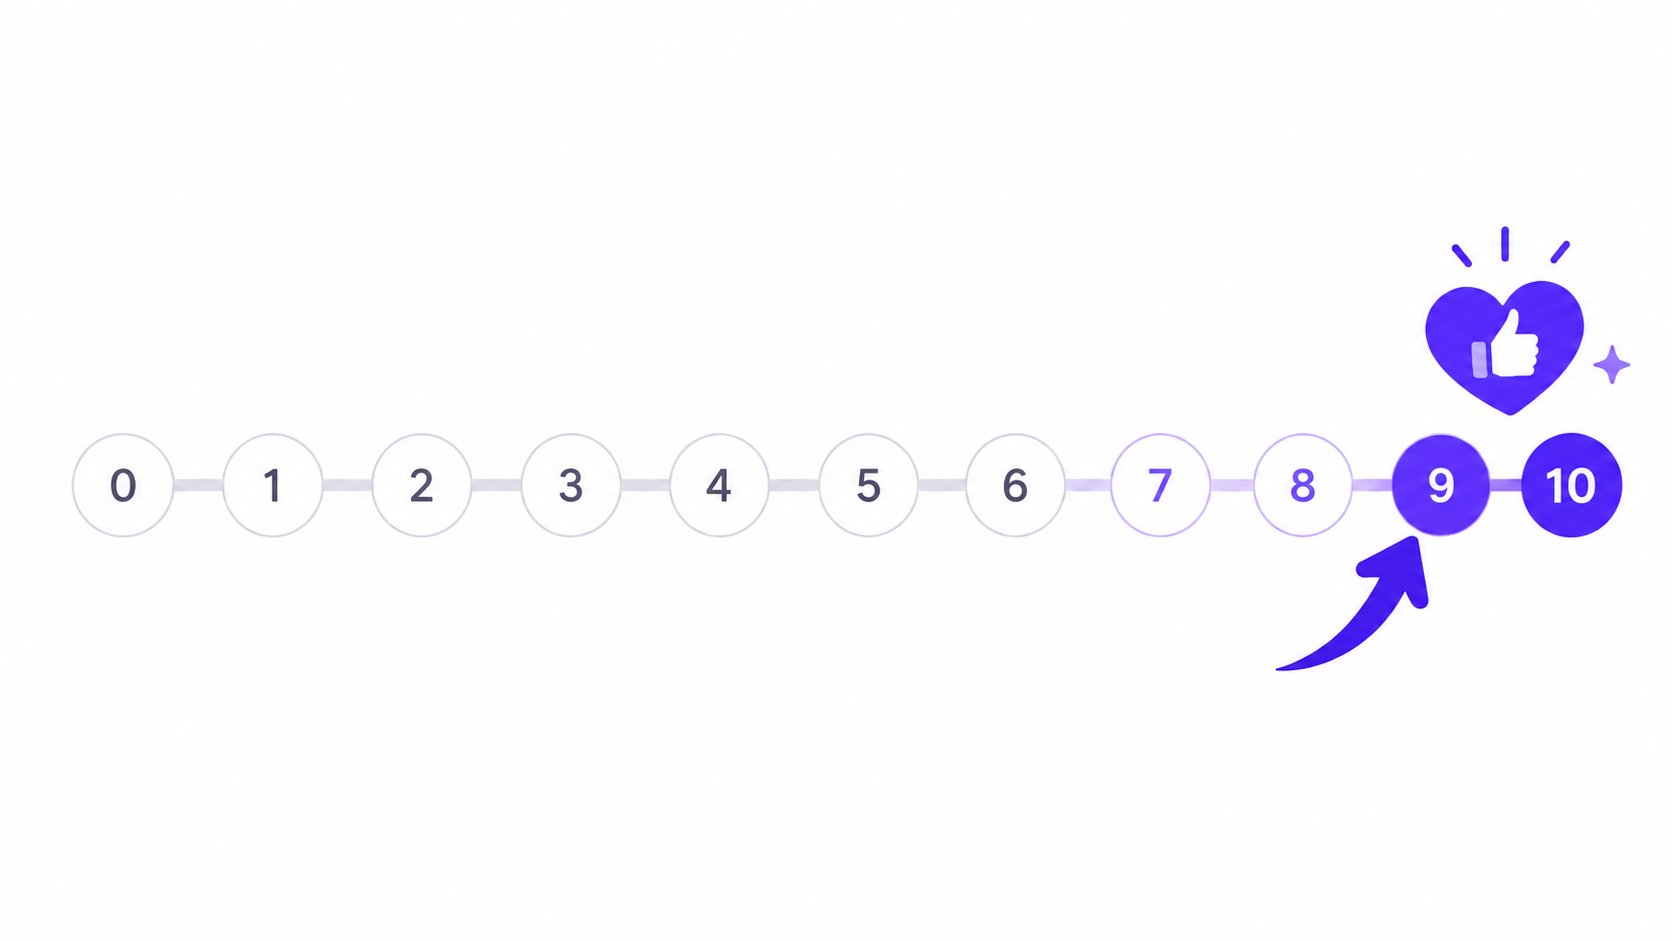
The scale runs from 0 to 10, not 1 to 10 and not 1 to 5. The specific scoring convention matters because the segmentation — promoters at 9–10, passives at 7–8, detractors at 0–6 — is calibrated to the 0–10 scale. Using a different scale produces a number that looks like an NPS score but is not comparable to any benchmark or to your own historical data.
The question wording is specific. "Recommend to a friend or colleague" measures active endorsement, not passive satisfaction. A customer who is satisfied but would not actively recommend your product to someone they know is a passive, not a promoter. The distinction captures something that a satisfaction rating misses — whether the customer is an active advocate or simply a non-churned account.
Question 2 — the reason question:
"What is the main reason for your score?"
Not "Do you have any additional comments?" Not a list of checkboxes asking which features they like or dislike. One open-text question asking for the main reason. This is the question that makes the score usable — a company with an NPS of 42 needs to know whether the promoters are driven by product quality, the support experience, or the value relative to alternatives, because those are three very different things to double down on.
The reason question produces qualitative data that requires analysis. For teams with low response volumes — under fifty per month — manual review is practical. For higher volumes, the AI-assisted analysis workflow in the guide to analysing survey responses with AI covers how to theme open-text responses at scale without losing individual signals.
Build an NPS survey. Question 1: "On a scale of 0 to 10,
how likely are you to recommend [company] to a friend
or colleague?" (0-10 scale). Question 2: "What is the
main reason for your score?" (open text). No other
questions. Keep it clean and fast.
This prompt generates a complete NPS survey in the AI form builder in under 10 seconds. The 0–10 scale generates as a numbered scale rather than a slider — the right format for a question where the specific number matters.
The Optional Third Question
The two-question format is the right default. There is one circumstance where a third question adds value: when you are running NPS across distinct customer segments or product areas and need to understand which part of the experience is driving the score.
"Which part of your experience with us do you most want to see improved?" followed by a short dropdown — onboarding, product features, support, pricing, billing — gives you a routing signal without extending the survey meaningfully. A detractor who selects "pricing" needs a different conversation than a detractor who selects "onboarding." A promoter who selects "product features" is your product team's most valuable feedback source.
The third question is only worth adding if you have the operational capacity to act on the segmentation it produces. If the response goes into a spreadsheet that one person reviews once a month, the segmentation is wasted. If it routes detractors to a support follow-up workflow and promoters to a case study request, it pays for the extra friction.
Segmenting Promoters, Passives, and Detractors
The NPS calculation is: percentage of promoters (9–10) minus percentage of detractors (0–6). Passives (7–8) do not count toward the score. The result is a number between -100 and +100.
Industry benchmarks vary significantly by sector. A score above 50 is generally considered excellent. A score above 70 is world-class. A score below 0 means more detractors than promoters. These benchmarks are only useful in comparison to your own historical trend — comparing your NPS to a competitor's reported number, which may be measured differently, calculated differently, and sampled differently, is not a useful exercise.
The more useful segmentation question is what you do with each group. Promoters are your most engaged customers — the ones most likely to respond to a referral programme, contribute to a case study, or participate in a customer advisory board. Doing nothing with promoters except noting their score is the most common missed opportunity in NPS programmes. A promoter who is never asked to do anything with their enthusiasm will cool into a passive over time.
Passives are often ignored in NPS analysis because they do not move the score. This is a mistake. Passives are customers who are satisfied but not delighted — often close to becoming promoters with a relatively small intervention. Understanding what would move a passive from a 7 to a 9 is frequently more actionable than understanding why detractors are at a 4, because the gap is smaller and the customer is already engaged.
Detractors require a specific response workflow. A detractor who scores 0–6 is a customer at significant churn risk. The reason question tells you why. The question is whether your team has a workflow to respond. A detractor response workflow does not need to be elaborate: a flag in the CRM or a Slack notification that triggers a follow-up from the account manager or support team within 24 hours. The intervention does not always save the account. It almost always produces data that is more useful than any survey question.
When to Send
The timing of an NPS survey matters as much as the questions in it. There are two sending patterns: relationship NPS, sent to the full customer base on a schedule, and transactional NPS, triggered by a specific interaction.
Relationship NPS sent quarterly produces a trend line that is comparable over time. The same questions, the same sample, at the same cadence, produces a score you can track. Sending it annually produces one data point per year — too slow to detect and respond to changes in customer sentiment. Sending it monthly produces survey fatigue, which suppresses response rates and makes comparisons unreliable.
Transactional NPS triggered after specific interactions — a support ticket resolution, an onboarding completion, a renewal conversation — measures the sentiment produced by that specific experience rather than the overall relationship. A company with a high relationship NPS and a low post-support transactional NPS has a support problem that the relationship score is masking. Running both is the complete picture.
The send timing relative to the interaction matters for transactional NPS specifically. Sending immediately after a support resolution, when the customer is still in the interaction context, produces inflated scores compared to sending 24 to 48 hours later, when the emotional peak has normalised and the customer has had some experience of the outcome.
What to Do With the Data
An NPS score that lives in a spreadsheet is not a customer feedback programme. It is a number. The score becomes useful when it is tracked over time, segmented by cohort, and connected to the actions that change it.
Segmenting by cohort means comparing NPS across customer tenure, product tier, and acquisition channel. A new customer NPS of 68 and a twelve-month customer NPS of 41 tells you something about your long-term value delivery that a blended average of 54 does not. The cohort that drives your score down is often not the one you expect, and the cohort generating your highest scores often contains your most promotable customers for case study and referral programmes.
Connecting the score to actions means closing the loop visibly. A product update that was prompted by detractor feedback, communicated to those detractors specifically, converts a portion of them into passives or promoters while simultaneously demonstrating to the full customer base that feedback has consequences. The customers most likely to answer your next NPS survey are the ones who saw something happen because of the last one.
Browse the customer feedback templates for pre-built NPS and CSAT formats. The customer feedback form guide covers the complementary post-interaction feedback design for teams building a complete customer feedback stack alongside their NPS programme.
Create a free account to save and share your NPS survey →
Free plan includes 100 responses per month and 3 AI form generations. No credit card required, and no account is needed to try the generator on the homepage.